


The number that told me the scoreline was lying
A few seasons back I watched a team lose 1-0 having battered the opposition for ninety minutes, and the next morning I backed them to beat a stronger side at a generous price. They won comfortably. That bet did not come from a hunch; it came from one number that told me the previous scoreline had been a fluke. That number was expected goals, and learning to read it changed how I see every match.
Expected goals, almost always shortened to xG, measures the quality of the chances a team creates rather than whether those chances were converted. It is the single most useful analytical tool to reach mainstream football in a generation, precisely because it cuts through the noise of finishing and goalkeeping luck to reveal how a side actually performed. Results lie constantly in a low-scoring sport; xG is the lie detector.
What xG actually measures
Every shot in a football match is assigned a value between zero and one, representing the probability that an average player would score from that exact situation. A tap-in from two yards might be worth 0.9 xG, meaning nine times out of ten it goes in. A speculative effort from thirty yards might be worth 0.03, a one-in-thirty chance. Add up every shot a team takes in a match and you get its total xG, an estimate of how many goals its chances were worth.
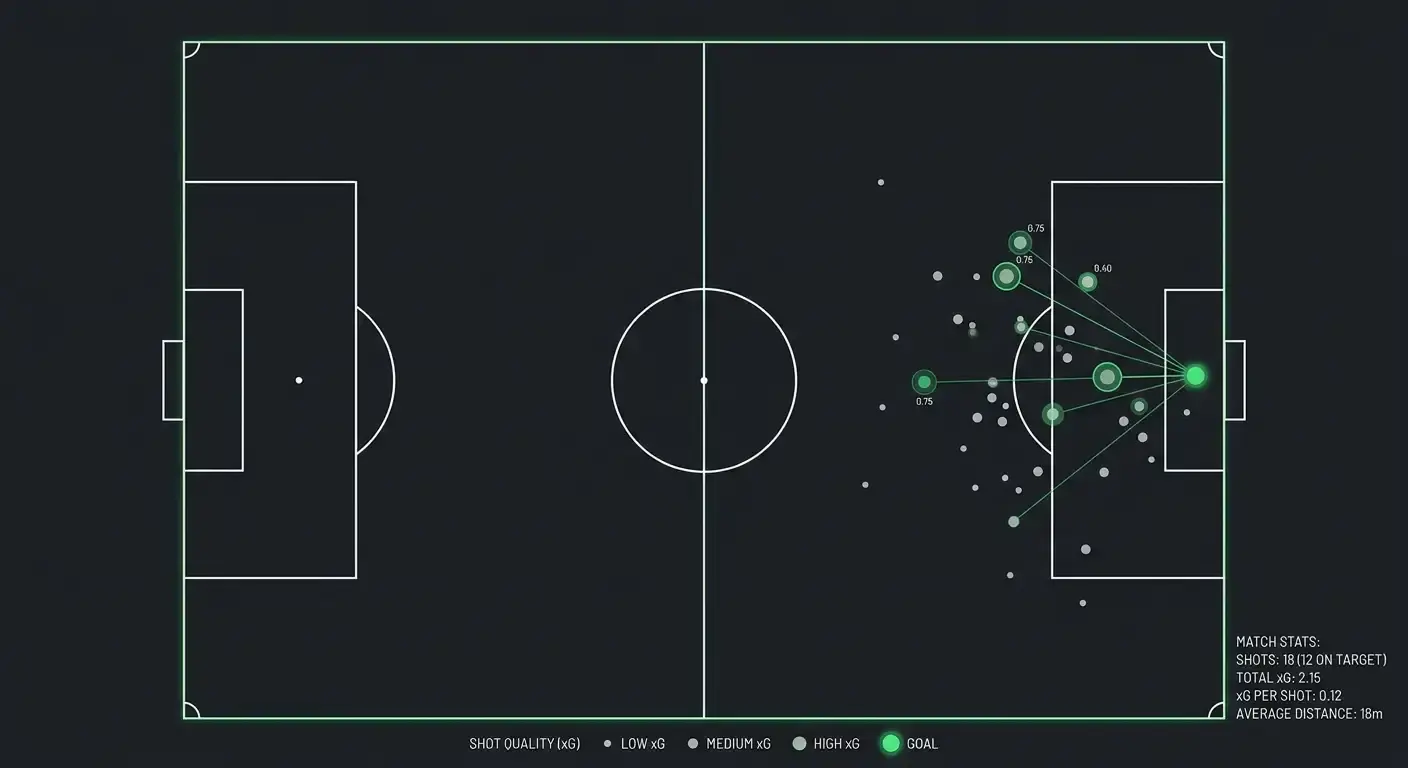
The value of each shot is calculated from a model trained on hundreds of thousands of historical shots, weighing factors like distance from goal, the angle, whether it was a header or a foot, whether it followed a through-ball or a cross, and how many defenders were in the way. The model does not care who took the shot; it asks only how often a chance of that type is converted across the whole sport. That detachment from individual reputation is exactly what makes it objective.
So when I say a team generated 2.4 xG in a match, I mean the chances they created would, on average, have produced about two and a half goals. If they actually scored none, the gap between performance and outcome is enormous, and that gap is information. The scoreline records what happened; xG records what should have happened, and the difference between the two is where betting edges are born.
When xG and the scoreline diverge
The whole power of xG lies in the moments it disagrees with the result, because those are the moments the market often misreads. A team can win 2-0 having created chances worth only 0.6 xG, riding two wonder-strikes and a flawless goalkeeping display, and the league table rewards them for a performance they are unlikely to repeat. The crowd sees a 2-0 win and prices the next match accordingly; the xG reader sees an overperformance primed to regress.
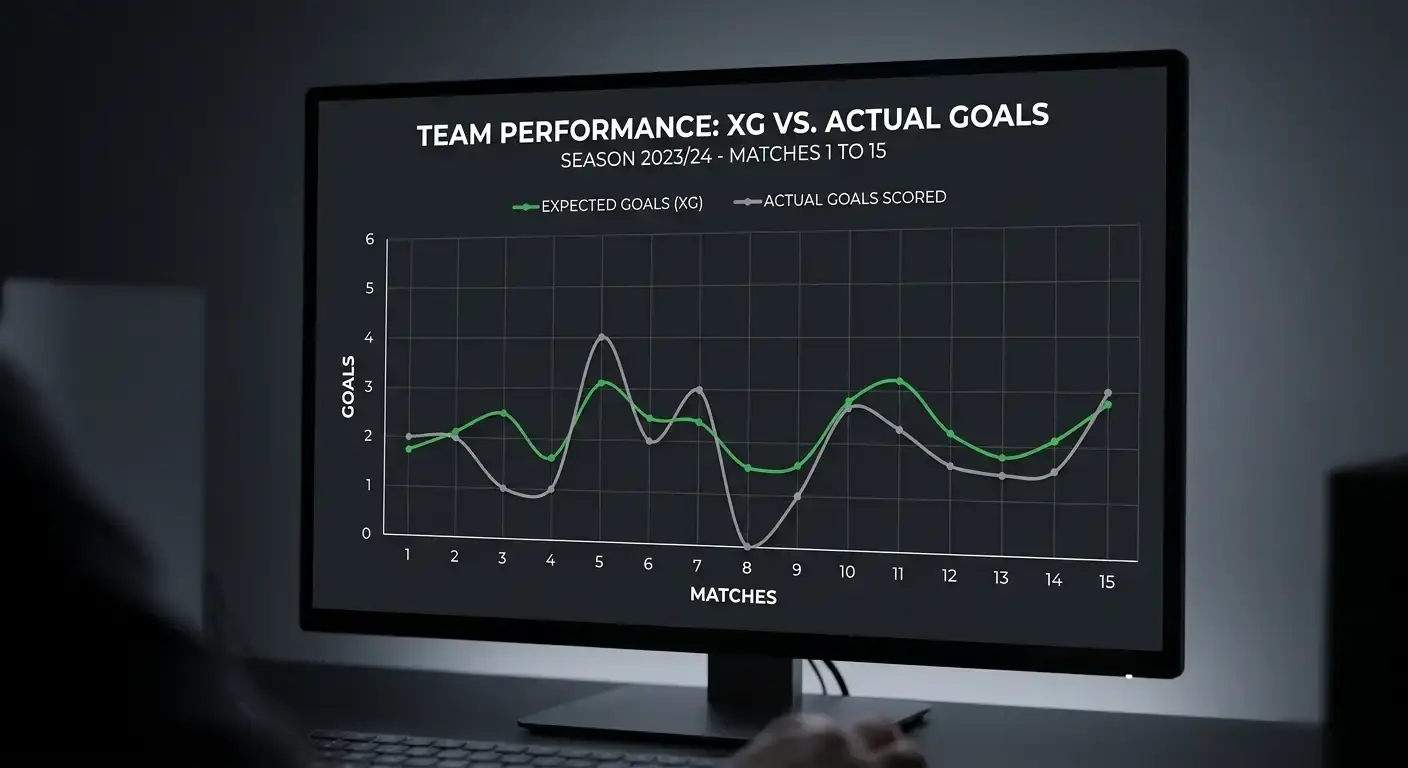
The reverse is just as valuable and often more profitable. A side that loses narrowly while dominating the xG, creating far more than they conceded, is performing well beneath a scoreline that flatters their opponent. These teams are systematically underpriced because the market anchors to results, and backing them before their finishing reverts to normal is one of the most reliable edges available to a patient bettor. I keep a rolling record of which teams are running hot or cold against their underlying numbers, and it flags value the raw form guide never could.
The key word is regression. Finishing and goalkeeping fluctuate wildly in small samples but trend towards the average over time, which means a team massively over or underperforming its xG is far more likely to correct than to continue. xG does not predict the next result with certainty, but it identifies which results were built on sand, and over a season that distinction is worth real money.

Putting xG to work across the markets
xG earns its keep in the goals markets most directly. European football generates over 40 percent of all global online betting revenue, and the totals market is one of its busiest products, which means the obvious goal averages are baked into every line. xG lets you go a layer deeper: a team whose recent low-scoring games hid high xG totals is a candidate to start winning overs once their finishing normalises, and the under-priced totals on those fixtures are where I hunt.

It also sharpens match-result and Asian handicap betting. A favourite that has been winning ugly, scraping results while losing the xG battle, is living on borrowed time, and fading them before the market catches up can be lucrative. Conversely, an underdog quietly outperforming its results in the underlying numbers is exactly the sort of side worth backing on a handicap line that still reflects their flattering scoreline. The relationship between xG and the totals market is so tight that the two are best studied together, and my guide to trading the total goals market shows how the goal expectation feeds directly into the lines you bet.
The discipline that makes xG useful is patience. The edge is never in a single match; it is in the accumulation of small mispricings across a season, backing teams the model says are better than their results and fading those it says are worse. One game tells you almost nothing. Twenty games of tracking the gap between xG and outcomes tells you which prices the market has wrong.
Where xG stops being useful
For all its power, xG is a tool and not an oracle, and the bettors who lose money with it are the ones who forget that. The most important limitation is sample size. A single match’s xG is noisy and frequently misleading, because one cleared-off-the-line chance or one disallowed goal distorts the figure. xG only becomes reliable across a run of matches, and treating a one-game number as gospel is a fast route to bad bets.

It also misses context that a watching eye catches. xG cannot fully capture game state, the way a team that goes 2-0 up sits back and concedes cheap late chances that inflate the opponent’s xG without reflecting genuine danger. It struggles with the very best finishers, who genuinely beat the average shot value through elite technique the model treats as luck. And different providers calculate xG differently, so two sources can disagree on the same match, which means you must know whose numbers you are reading.
The broader caution is about how data is marketed and consumed. Keith Whyte, who led the National Council on Problem Gambling for years, argued that the answer is “teaching this next generation of kids how to make more informed choices, how to think critically about the marketing of everything that’s gamified”. xG is increasingly sold as a shortcut to easy profit, and that framing is exactly what a critical bettor must resist. The number is a lens for thinking more clearly about football, not a machine that prints winners. Used with patience, an understanding of regression and a healthy scepticism about any single figure, xG is the closest thing football betting has to genuine insight. Treated as a crystal ball, it disappoints as reliably as any tip.
